


Let Reps Sell, Creatio Handles the Rest

Did you know that over half of sales leaders think that inefficiencies with their CRM system are costing them sales? It's a big deal because sales analytics is key to business success, and it’s an area where many regular CRM systems fall behind.
Think about it like this: running a business without sales analytics is like trying to find a treasure without a map. You might have great products and a good team, but how do you know what's working?
Sales analytics is that map. It helps you understand your sales data. For example, if your business has an excellent quarter, you'll want to know why. Was it a new product? A marketing campaign? Sales analytics can tell you.
This guide is here to help. We'll show you how to watch your sales, analyze them, and make intelligent choices. Ready to find out how? Let's get started.
What is Sales Analytics?
Sales analytics combines, analyzes, and interprets sales data to understand and improve sales performance. Sales leaders and strategists perceive it as a powerful tool that helps them set realistic goals, fine-tune internal processes, and more accurately predict future sales and revenue.
Sales analytics breaks down complex information into clear, actionable insights. Here's a snapshot of what sales analytics aims to uncover:
- Sales history or descriptive analysis,
- Future sales forecasting or predictive analysis,
- Strategic action planning or prescriptive analysis, and more.
Here’s an example.
A laptop manufacturer can compare sales revenue from different years to spot trends. Suppose they had year-end revenue numbers of $50 million in 2022 and $65 million in 2023. This jump suggests a growth in sales.
They could also look at the average purchase value of their customers. Imagine in 2022, the average laptop sale was $800, but in 2023, it rose to $950. This could mean customers are buying more expensive models.
Additionally, examining lead conversion rates can be insightful. If in 2022, 10 out of every 100 leads turned into sales, but in 2023, this number increased to 15, it shows their sales tactics are improving.
Analyzing their sales data, the laptop manufacturer discovers:
- A growing preference for high-end models among customers. The insight helps in shaping their product offering and manufacturing strategies. It might also convince them to invest more in R&D.
- An increase in yearly sales revenue indicates business growth. The insight tells the business managers to explore potential expansion opportunities.
- Improved lead conversion rates, reflecting more effective sales strategies. The sales manager will understand that their recent sales and promotional strategies are working. As a result, they might put more focus on it and discard the less effective strategies.
These insights help in fine-tuning their sales strategy and boosting overall revenue.
10 Key Sales Metrics to Watch
So, having the right metrics at your fingertips is like having a roadmap to sales success. These key metrics are not just figures but critical indicators that tell us how well the sales process is functioning.
However, there’s no one-size-fits-all approach when you choose which metrics to use. Each serves a different purpose and identifies further insights. By carefully selecting and tracking the right metrics, businesses can sharpen their sales strategies, spot trends, and make decisions that drive success.
Here are 10 crucial sales metrics for any business looking to enhance its sales performance. Let’s find out how to track each metric and how they help you with decision-making.
1. Sales revenue
What is it: Sales revenue is the total amount of money generated from sales of goods or services. It's often considered the most straightforward and crucial metric in sales analytics.
How to calculate: Sales Revenue = Number of Units Sold × Price per Unit
Analysis and example: Sales revenue clearly shows a company's effectiveness in generating sales. It's the foundation upon which businesses measure growth, plan strategies, and make critical decisions.
This metric reveals the overall financial health of a business. It shows whether sales strategies are working and if products or services are well-received.
If a smartphone manufacturer sells 10,000 units in a month at $300 each, their sales revenue for that month would be 10,000 x $300 = $3,000,000
While sales revenue indicates the total income, it doesn’t account for the costs and expenses of generating those sales. Hence, a high sales revenue doesn't necessarily mean the company is profitable, as it might have high production or marketing costs.
This leads businesses to explore additional sales metrics to complement sales revenue analysis.
2. Sales funnel performance
What is it: Sales funnel performance measures how effectively your company turns prospects into paying customers. This metric tracks customer interactions from initial brand awareness through to purchase.
How to calculate: Conversion Rate = ( Number of Contacts in Later Stage / Number of Contacts in Earlier Stage ) × 100%
You can apply this to various stages like Lead to MQL (Marketing Qualified Lead), MQL to SQL (Sales Qualified Lead), SQL to Opportunity, and Opportunity to Closed-Won Deal.
Analysis and example: The sales funnel performance analysis helps you understand the efficiency of different stages of your sales process. It also highlights where potential customers drop off, allowing you to identify and fix leaks in your sales funnel.
Suppose your company’s conversion rate from lead to MQL is 20%, and from MQL to SQL it's 50%. If you have 1,000 leads, 200 become MQLs, and 100 become SQLs. This breakdown allows you to assess each stage's efficiency against past performance and industry benchmarks.
3. Customer Acquisition Cost (CAC)
What is it: Customer Acquisition Cost (CAC) measures the total expense a business incurs to gain a new customer. It's a critical metric for assessing customer profitability and the efficiency of sales and marketing efforts.
How to calculate: CAC = Total Cost of Sales and Marketing / Number of Customers Acquired
Analysis and example: A software company spends $50,000 on sales and marketing initiatives and successfully acquires 800 new customers for its project management tool. The CAC in this scenario would be $50,000 / 800 = $62.5 per customer.
The calculation provides a clear perspective on the investment required to attract each customer. For sustainable growth, the company should aim to have this CAC lower than the Customer Lifetime Value (CLV) of a customer, ensuring that the cost of acquiring a customer doesn't outweigh the revenue they generate.
4. Customer Lifetime Value (CLV)
What is it: Customer Lifetime Value (CLV) is the total revenue a business can expect from a single customer throughout their relationship. It's crucial for understanding the long-term value of customers and guiding strategic decisions.
How to calculate: CLV = Average Purchase Value × Purchase Frequency × Average Customer Lifespan
Analysis and example: Consider a streaming service. The average monthly subscription fee is $15, and customers tend to stay subscribed for an average of two years. Average Purchase Value = $15; Purchase Frequency = 1 per month; Customer Lifespan = 2 years. CLV = $15×1×12×2 = $360.
5. Sales growth rate
What is it: Sales growth rate measures the increase in sales over a specific period, reflecting a business's financial performance and future potential. It's vital for understanding the market position and guiding strategic decisions.
How to calculate: Sales Growth Rate = ( ( Current Period Sales − Previous Period Sales ) / Previous Period Sales ) × 100%
Analysis and example: If a boutique clothing brand earned $500,000 in sales this year compared to $450,000 last year, the sales growth rate would be: (($500,000−$450,000)/$450,000) x 100% = 11.11%
This positive growth rate indicates an upward trajectory in sales, highlighting successful business strategies. Conversely, a negative growth rate signals a need for strategic reassessment.
6. Conversion rate
What is it: Sales conversion rate serves as a key indicator of the sales team's proficiency in transforming leads into actual customers. This metric is pivotal for assessing the overall effectiveness of both sales and marketing initiatives..
How to calculate: Conversion Rate = (Number of Successful Conversions / Total Number of Leads or Visitors) x 100%
Analysis and example: If a tech company's marketing team generates 200 leads from a trade show and the sales team converts 30 into customers, the conversion rate would be (30 / 200) x 100% = 15%. This figure helps assess the efficiency of the sales process and should be benchmarked against past performance and industry averages.
7. Average deal size
What is it: Average deal size is a key indicator of the average revenue earned per closed deal. It's calculated regularly (monthly or quarterly) and offers insights into sales processes, pipeline trends, and sales rep performance.
How to calculate: ADS = Sum of Revenue from Closed Deals / Total Number of Closed Deals
Analysis and example: If a digital marketing agency closes four deals worth $8,000, $7,500, $9,000, and $8,500, the ADS is: ($8,000 + $7,500 + $9,000 + $8,500) / 4 = $8,250. The analysis helps you understand the value of average sales and compare performance against industry benchmarks.
8. Churn rate
What is it: Churn rate is the percentage of customers who stop doing business with a company over a specific period. It's crucial for assessing customer retention and satisfaction, as well as the effectiveness of marketing efforts.
How to calculate: Churn Rate = (Number of Customers Lost During the Period / Total Customers at the Start of the Period) x 100%
Analysis and example: For instance, if a streaming service starts the month with 1000 subscribers but ends with 950, the churn rate is: (1000 - 950) / 1000 x 100% = 5%. This sales analytics metric is crucial for businesses using subscription models to understand and reduce customer attrition.
9. Sales pipeline velocity
What is it: Pipeline velocity measures the speed at which leads and prospects move through your sales pipeline, indicating the efficiency and effectiveness of the sales process.
How to calculate: Pipeline Velocity = (Number of SQLs x Average Deal Size x Average Win Rate) / Length of Sales Cycle.
Analysis and example: Imagine a cloud services company with 40 SQLs, an average deal size of $15,000, and a win rate of 0.4 (40%). If their sales cycle averages 20 days, the pipeline velocity is: (40 x $15,000 x 40%) / 20 = $12,000.
This means approximately $12,000 in revenue is moving through the pipeline daily, a crucial metric for forecasting and business planning.
10. Sales cycle length
What is it: Sales cycle length is the average time taken from the first interaction with a prospect to closing the deal. It's used for sales forecasting and understanding sales process efficiency.
How to calculate: Sales Cycle Length = Total Number of Days to Close All Deals / Total Number of Closed Deals
Analysis and example: Suppose a digital advertising agency closes three deals. Deal 1 takes 45 days, Deal 2 takes 35 days, and Deal 3 takes 55 days. The total is 135 days. The average sales cycle length is 135 / 3 = 45 days.
This metric helps anticipate when revenue from sales will be realized, aiding in future business strategy and sales forecasting.
Key Features of Sales Analytics Software
Amidst myriad analytical tools, it is crucial to identify the key features that define robust sales analytics software. Below, we delve into the fundamental characteristics typical of most modern analytical platforms, providing a glimpse into the essential elements driving effective sales analysis.
Data visualization and real-time reporting
One of the key reasons for businesses to use a sales analytics platform is to get real-time visibility into complex sales and customer data sets. The software should be able to transform complex datasets into understandable graphs and charts, providing immediate insights.
Sales forecasting
This feature allows businesses to anticipate future revenue, plan resources effectively, and make strategic decisions. For example, by analyzing historical sales data and market trends, a sales analytics platform can predict future sales performance, helping organizations allocate resources, set realistic targets, and adjust their sales strategies to meet or exceed goals.
Seamless integration
The ability to integrate allows organizations to unify data from diverse sources like CRM systems and financial tools facilitating a thorough and precise analysis of sales metrics. Consider the connection between sales analytics and ERP – this integration improves financial transparency by directly associating sales data with financial transactions, invoicing, and accounting procedures.
Security
Data security is crucial to safeguard sensitive business information, customer details, and proprietary sales strategies. If customer data in a sales analytics platform is compromised, it could result in trust erosion, legal challenges, and a negative impact on customer relationships.
Mobile accessibility
This feature ensures that sales professionals can stay connected and access vital information anytime, anywhere, contributing to improved efficiency and responsiveness in the field. For instance, a sales representative attending a client meeting can quickly access the latest sales figures, customer information, or product details through a mobile app.
Customization and scalability
Customization allows organizations to tailor analytics tools to their specific industry, workflows, and objectives, ensuring a more relevant and effective solution. Additionally, scalability is crucial to support business growth, enabling the platform to handle increased data volumes and user demands as the organization expands.
Elevate Your Sales Analytics Using Creatio CRM
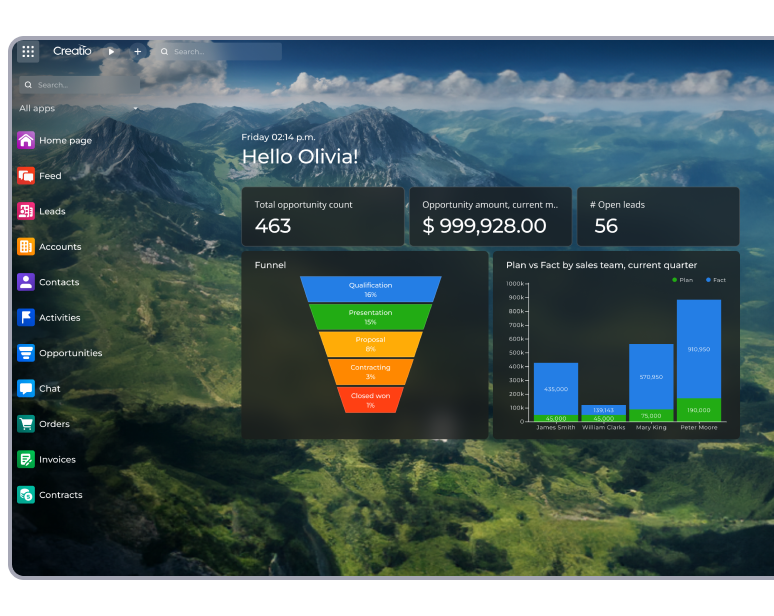
Creatio's Sales product is an end-to-end CRM platform designed to automate diverse sales processes, offering unparalleled flexibility. With rich dashboards and reporting tools tailored for various sales roles, it enables real-time tracking of diverse KPIs and historical analysis. The user-friendly, no-code interface allows effortless customization of all analytical tools.
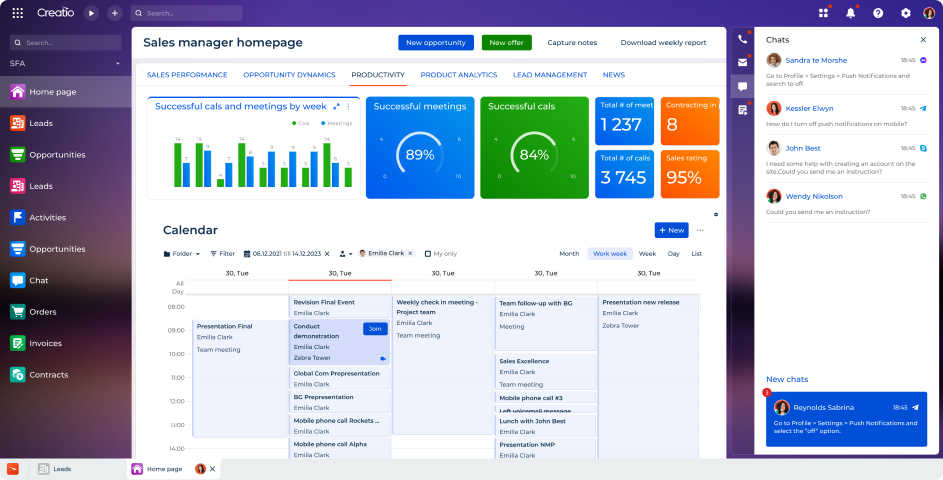
Beyond delivering timely and detailed insights, Creatio facilitates data consolidation, automates lead and opportunity workflows, conducts sales forecasts, manages contracts and documents, and enhances sales collaboration. Enhance your sales analytics using Creatio – an integrated solution that blends robust analytics with streamlined sales process automation.