


Ai-Native CRM: Achieve Powerful Productivity Gains

What is a Workflow Diagram?
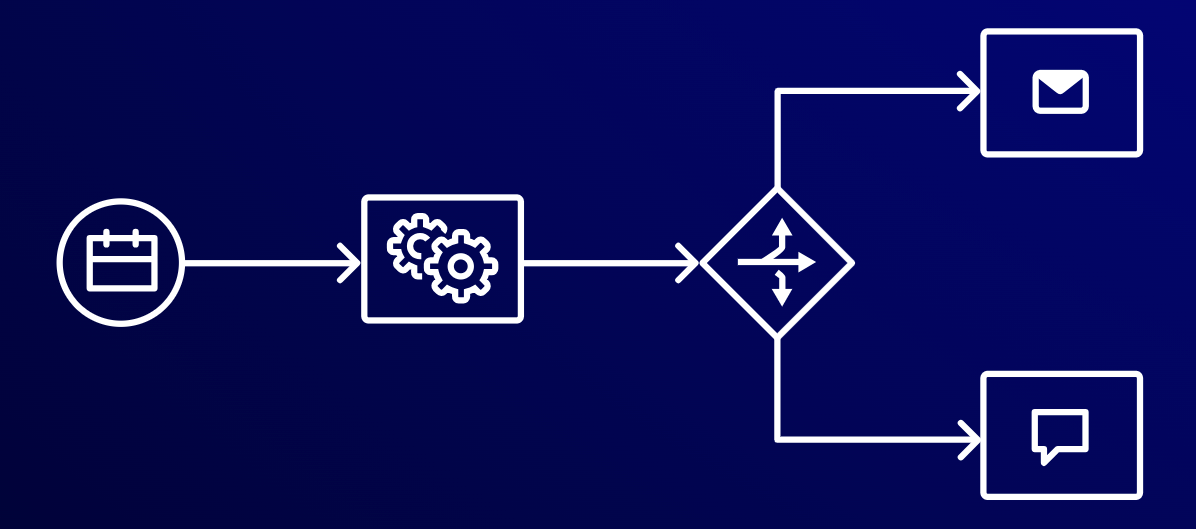
A workflow diagram is a visual overview of a business process. The diagram maps out the steps of how a process is completed from start to finish through a flowchart. It’s a way to show business analysis on how work is done and accomplished. It helps outline who is responsible for what at each step, as well as define, standardize, and identify critical or weak areas of the process. The design of the diagram is created using standardized shapes and symbols to show the flow from one step to another.
The workflow diagram helps allocate tasks to responsible departments and personnel. This is useful in helping employees comprehend their roles in each workflow and to streamline processes across departments. However, to create a proper workflow, the parties involved need to examine, plan, and conduct tests on the various steps. During this process, weaknesses can be exposed and better solutions provided. This helps improve teamwork and offers a platform where employees can weigh in on the benefits or shortcomings of a particular workflow.
Types of Workflow Diagrams
Although there are endless versions and variations of workflow diagrams, organizations tend to opt for the following to document processes:
Business process modeling notation (BPMN)
BPMN is a standard for business process modeling, meaning for creating a visual representation of a business practice or a process flow that establishes the relationships between processes and departments. This design is used to give senior stakeholders the clarity and oversight needed to make informed decisions as it is generally simpler to comprehend than narrative text. Creatio, for example, leverages BPMN 2.0 standard, which enables both business and IT to easily understand and work with business process mapping models.
ANSI Flowchart
The ANSI flowchart derived from the American National Standards Institute (ANSI) in the 1970s. This type of flowchart is used to document the details of a business process and its aim is to showcase the work being accomplished. Most organizations today use it to demonstrate how an employee’s payroll is processed and approved for disbursement.
UML activity (unified modeling language)
UML was built as a common visual modeling language that could be used in software development yet understood by business users. UML functions like a flowchart, showing different steps and sequential tasks. It is commonly referred to as the flow of control.
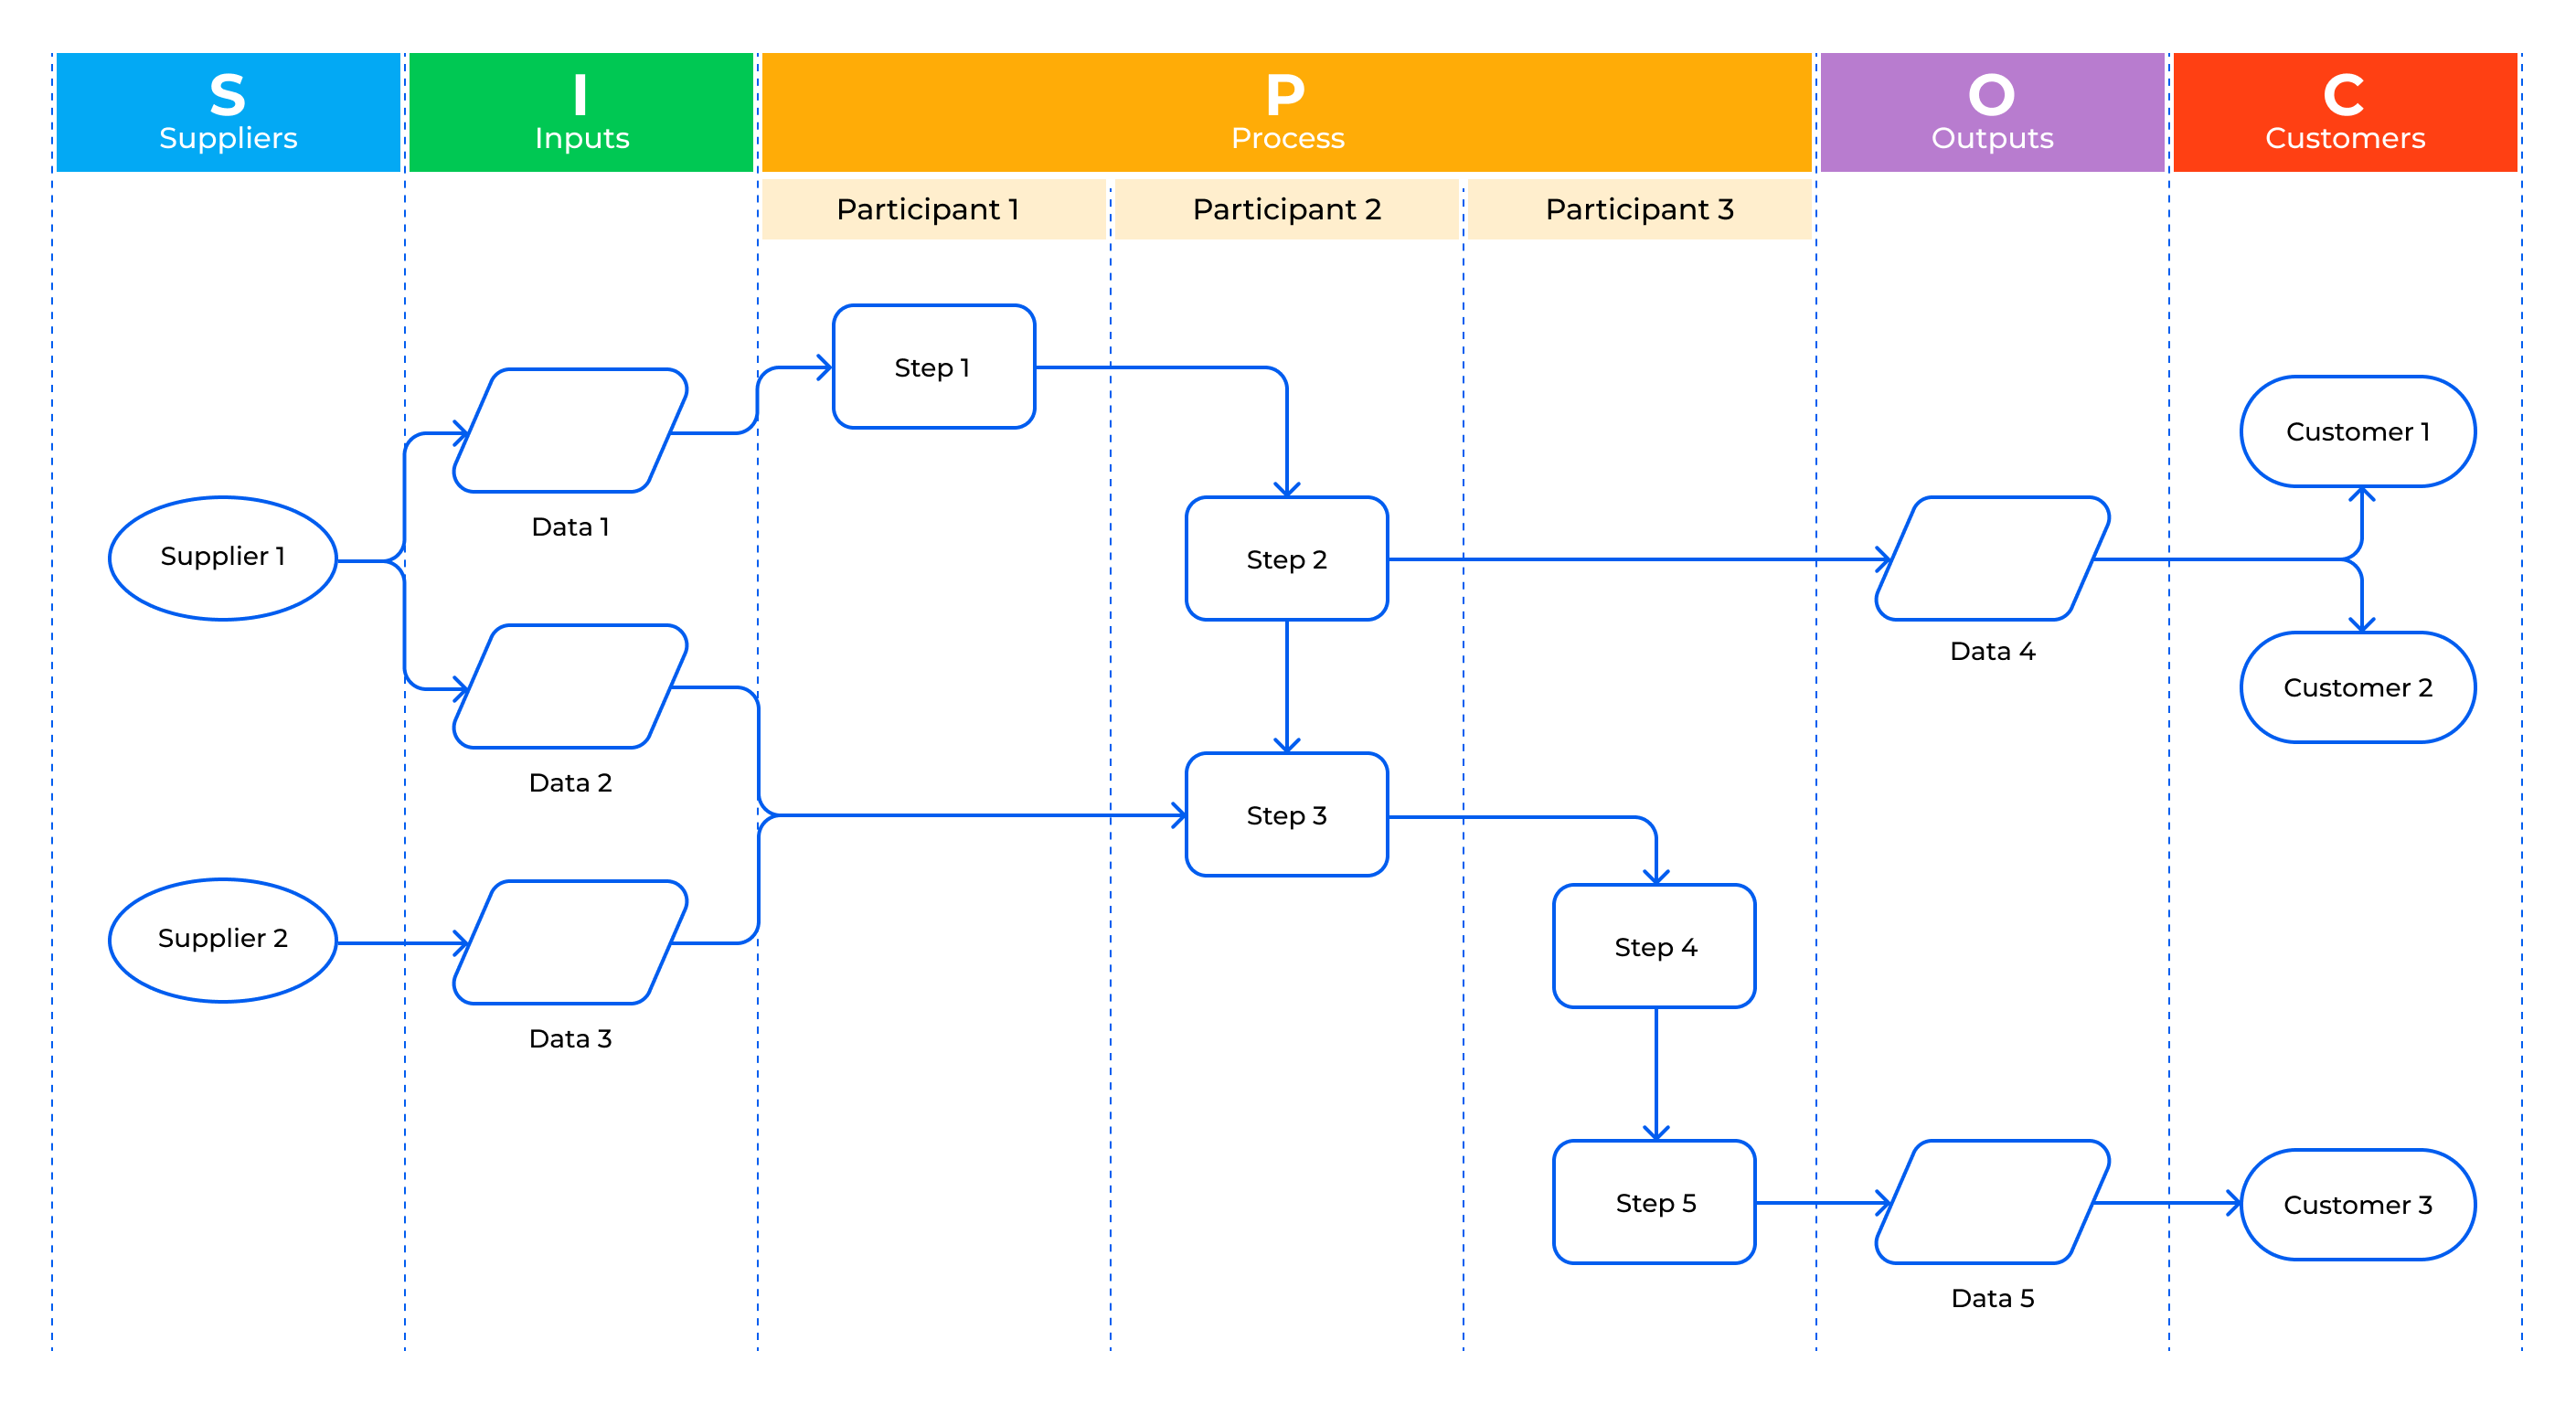
SIPOC (supplier input process output customer)
The SIPOC diagram is a tool used to identify necessary process improvements before any changes are made to a process. The diagram is in table form, and it summarizes the inputs and outputs of the process in question.
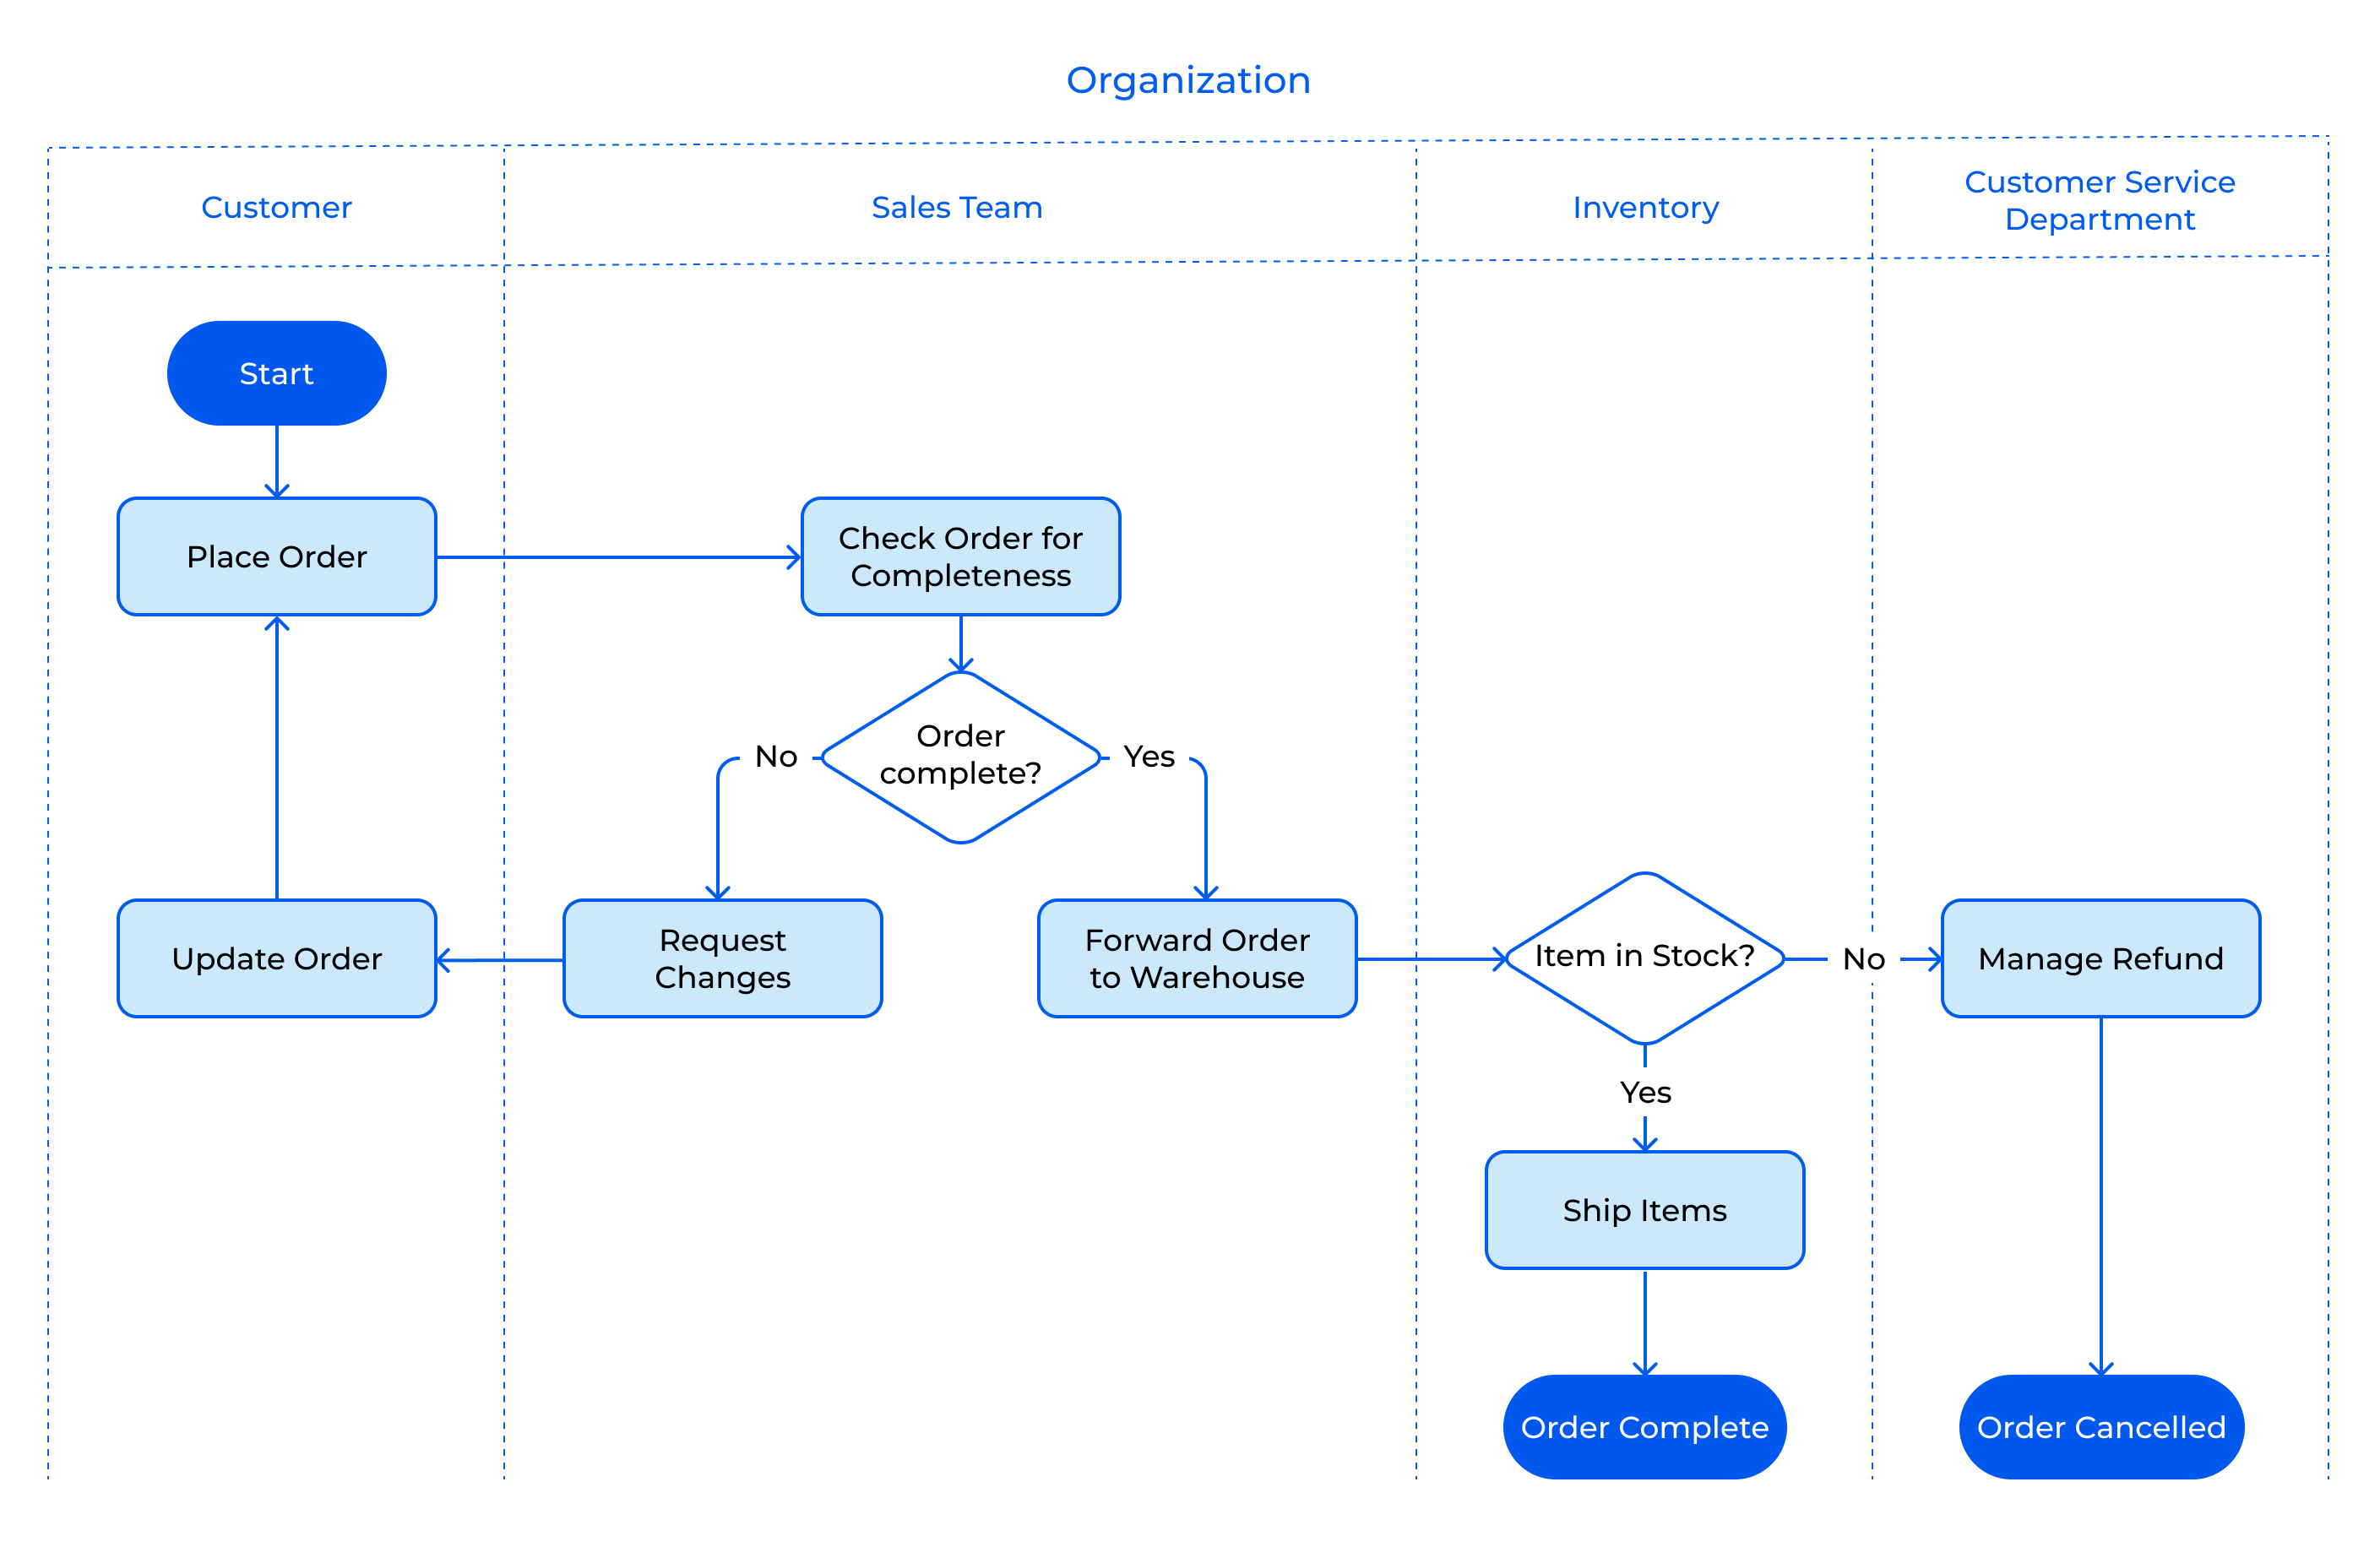
Swimlane diagram
The swimlane workflow diagram is ideally used to show multiple flows of data side by side. For instance, when a process interacts with different departments of an organization or requires the collaboration of multiple teams. A swimlane workflow is similar to that of a traditional workflow, but the swimlane workflow allows for the building of collective branches or swimlanes where an interaction of data takes place. Some complicated processes include upwards of five swimlanes to capture the interactions between multiple departments or multiple roles in a cross-functional teams.
Benefits of Workflow Diagram
Workflow diagrams use visual tools to help businesses streamline their operations, automate processes and define best practices leading to several benefits as outlined below:
1. Helps identify bottlenecks
Using or creating a workflow diagram assists organizations in learning about daily activities and, employee duties while squeezing out inefficiencies. All tasks happen out in the open, allowing for the identification, elimination or improvement of processes where needed.
2. Improve revenues
Once process weaknesses are identified and appropriate adjustments are made, operational efficiency improves. Well-planned workflows provide employees with specific goals, therefore no time or unnecessary resources are wasted on unplanned work.
3. Process automation
The automation of processes introduces efficiency and system overhead, reduced paperwork and improved employee effectiveness. When workflows and complex processes are standardized and automated, errors are less likely to occur. Standardized workflows also generate more consistent outputs which result in identical, successful outcomes every time. An efficient way of creating a workflow is by investing in a user-friendly, yet powerful workflow management solution like Creatio. The workflow solution will provide the right tools to visually represent the workflow including conditional tasks and decision branches. The software then runs the workflow automatically, following the outlined, sequential steps.
4. Increases efficiency
In a workflow diagram, the responsibilities of each job role are well defined. Employees are aware of their tasks, they can track the progress of the workflow and address any bottlenecks should they arise.
5. Improves teamwork and communication
The workflow diagram enhances team collaboration by helping keep work organized and trackable. As a result, employees are more collaborative and goal-driven.
6. Better customer services
Organizations that use workflow diagrams tend to automate more activities. As a result, teams save the time that was spent on manual tasks such as sending emails, and can focus more on attending to the needs of customers.
Workflow Diagram Examples
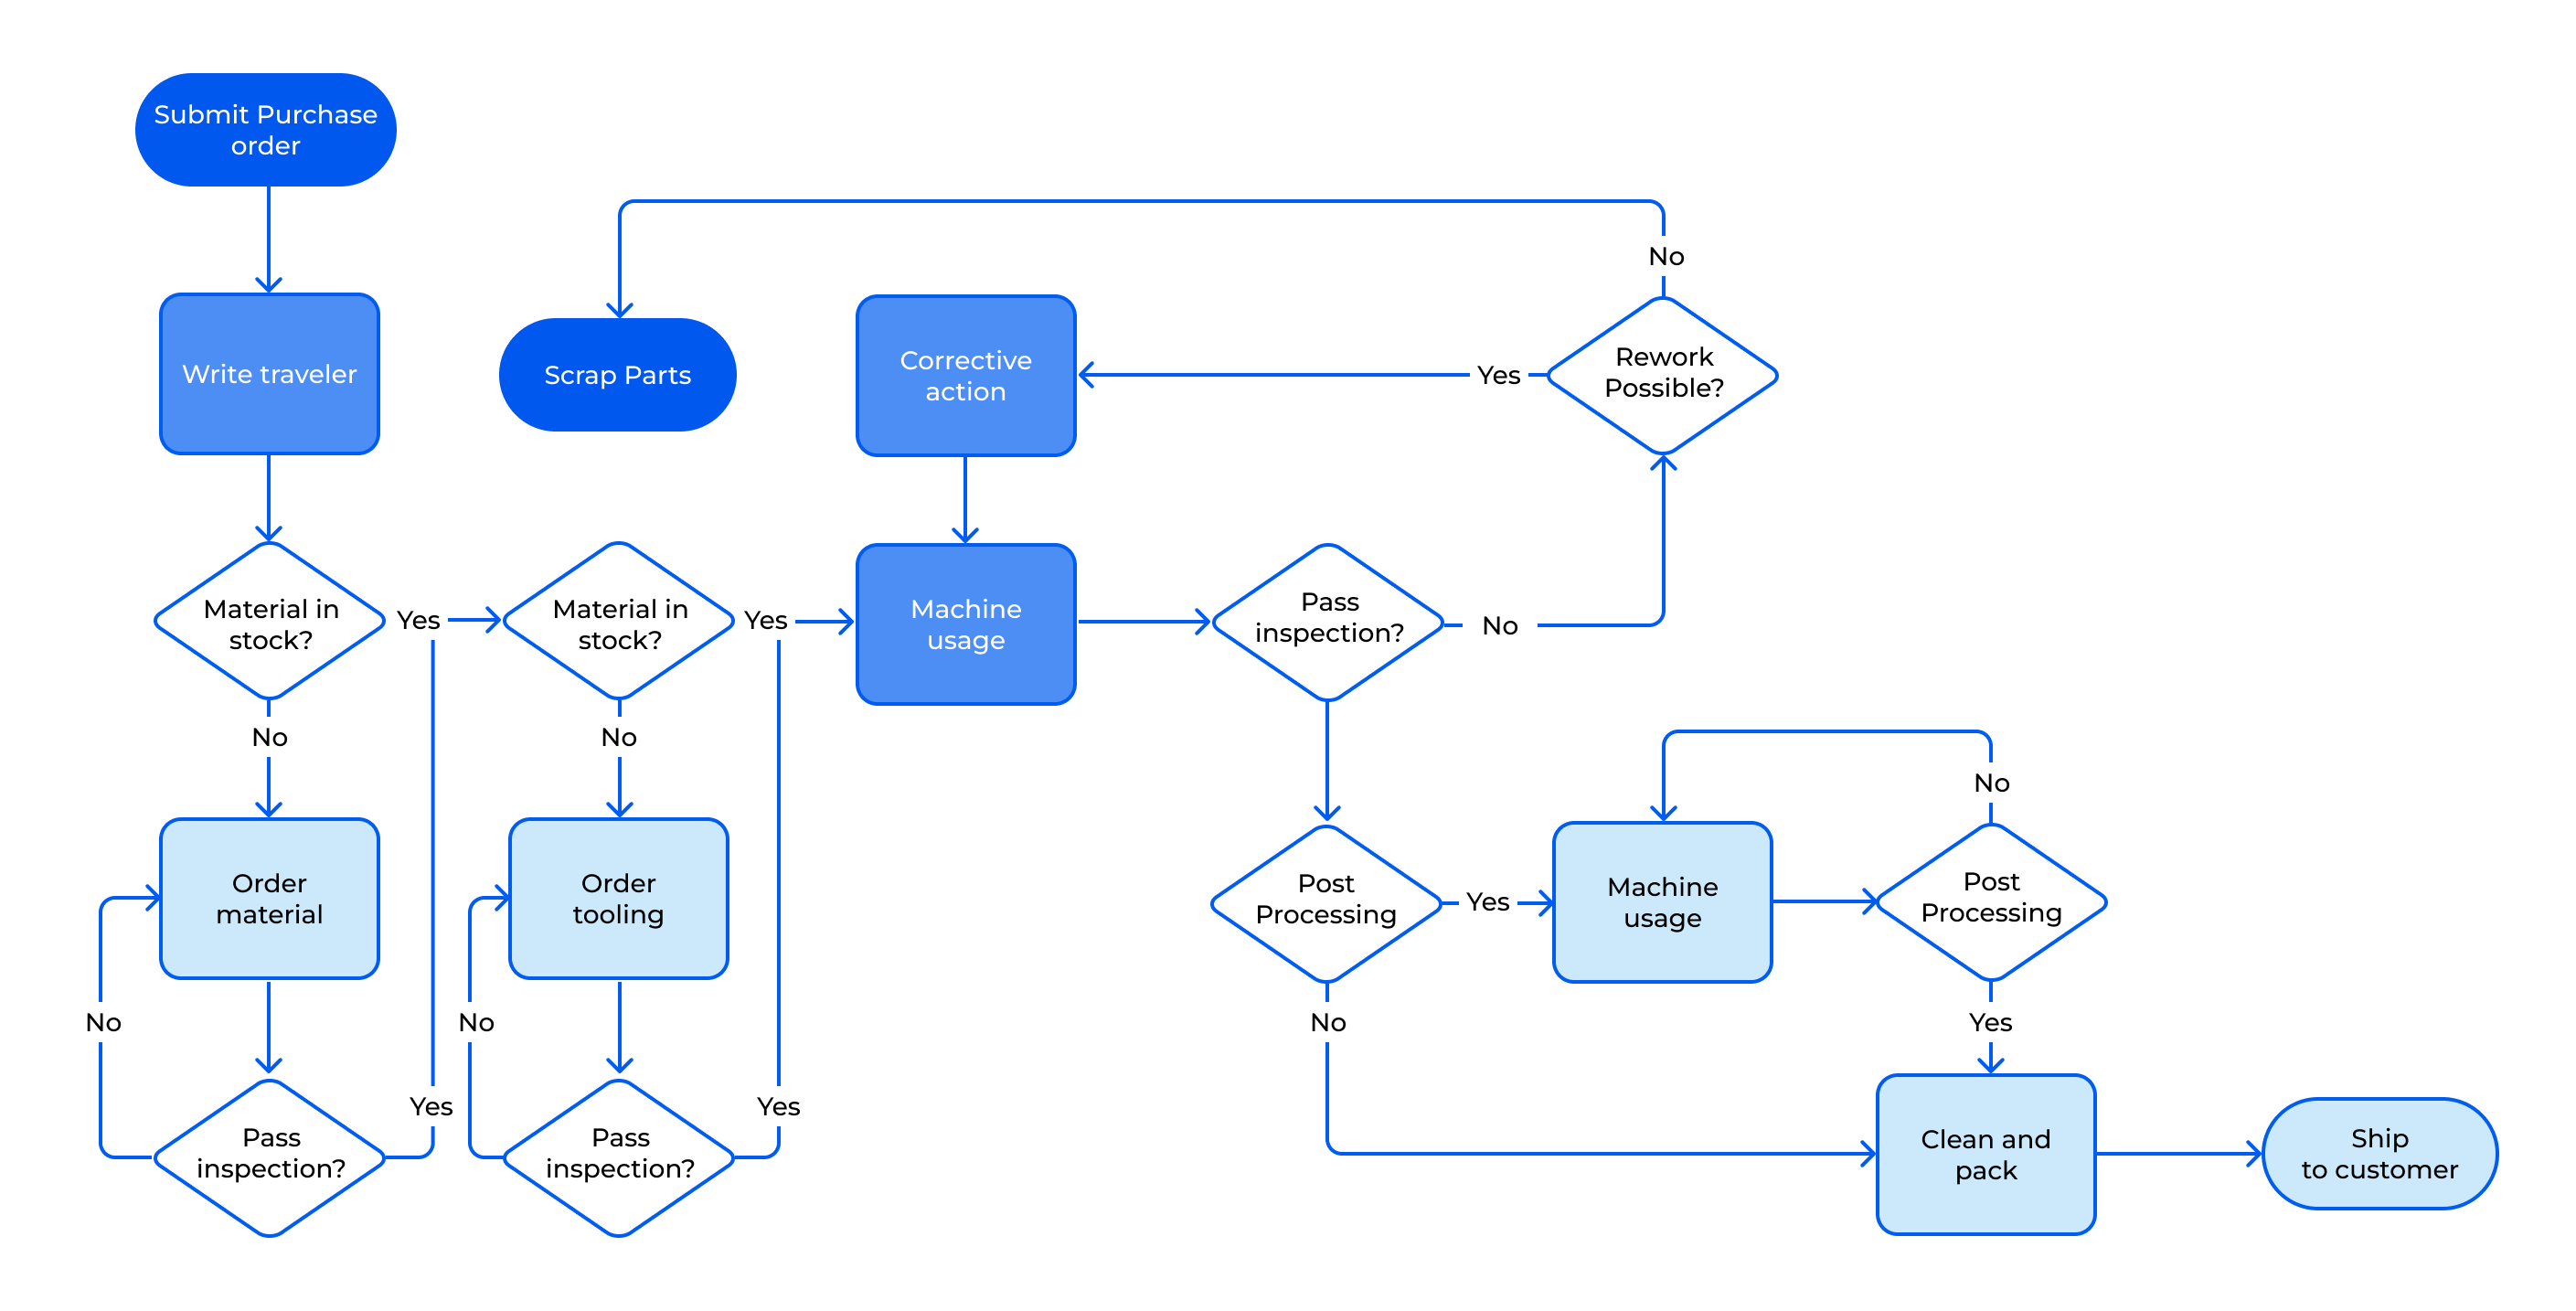
Initially, workflow charts were designed for manufacturing industries. However, workflow diagrams are compatible with all types of industries, departments, and processes, for example:
Military
Military forces can utilize workflow diagram tools to onboard new recruits. Onboarding of new recruits entails legal paperwork, access to admin resources, orientation, and relevant training.
Finance
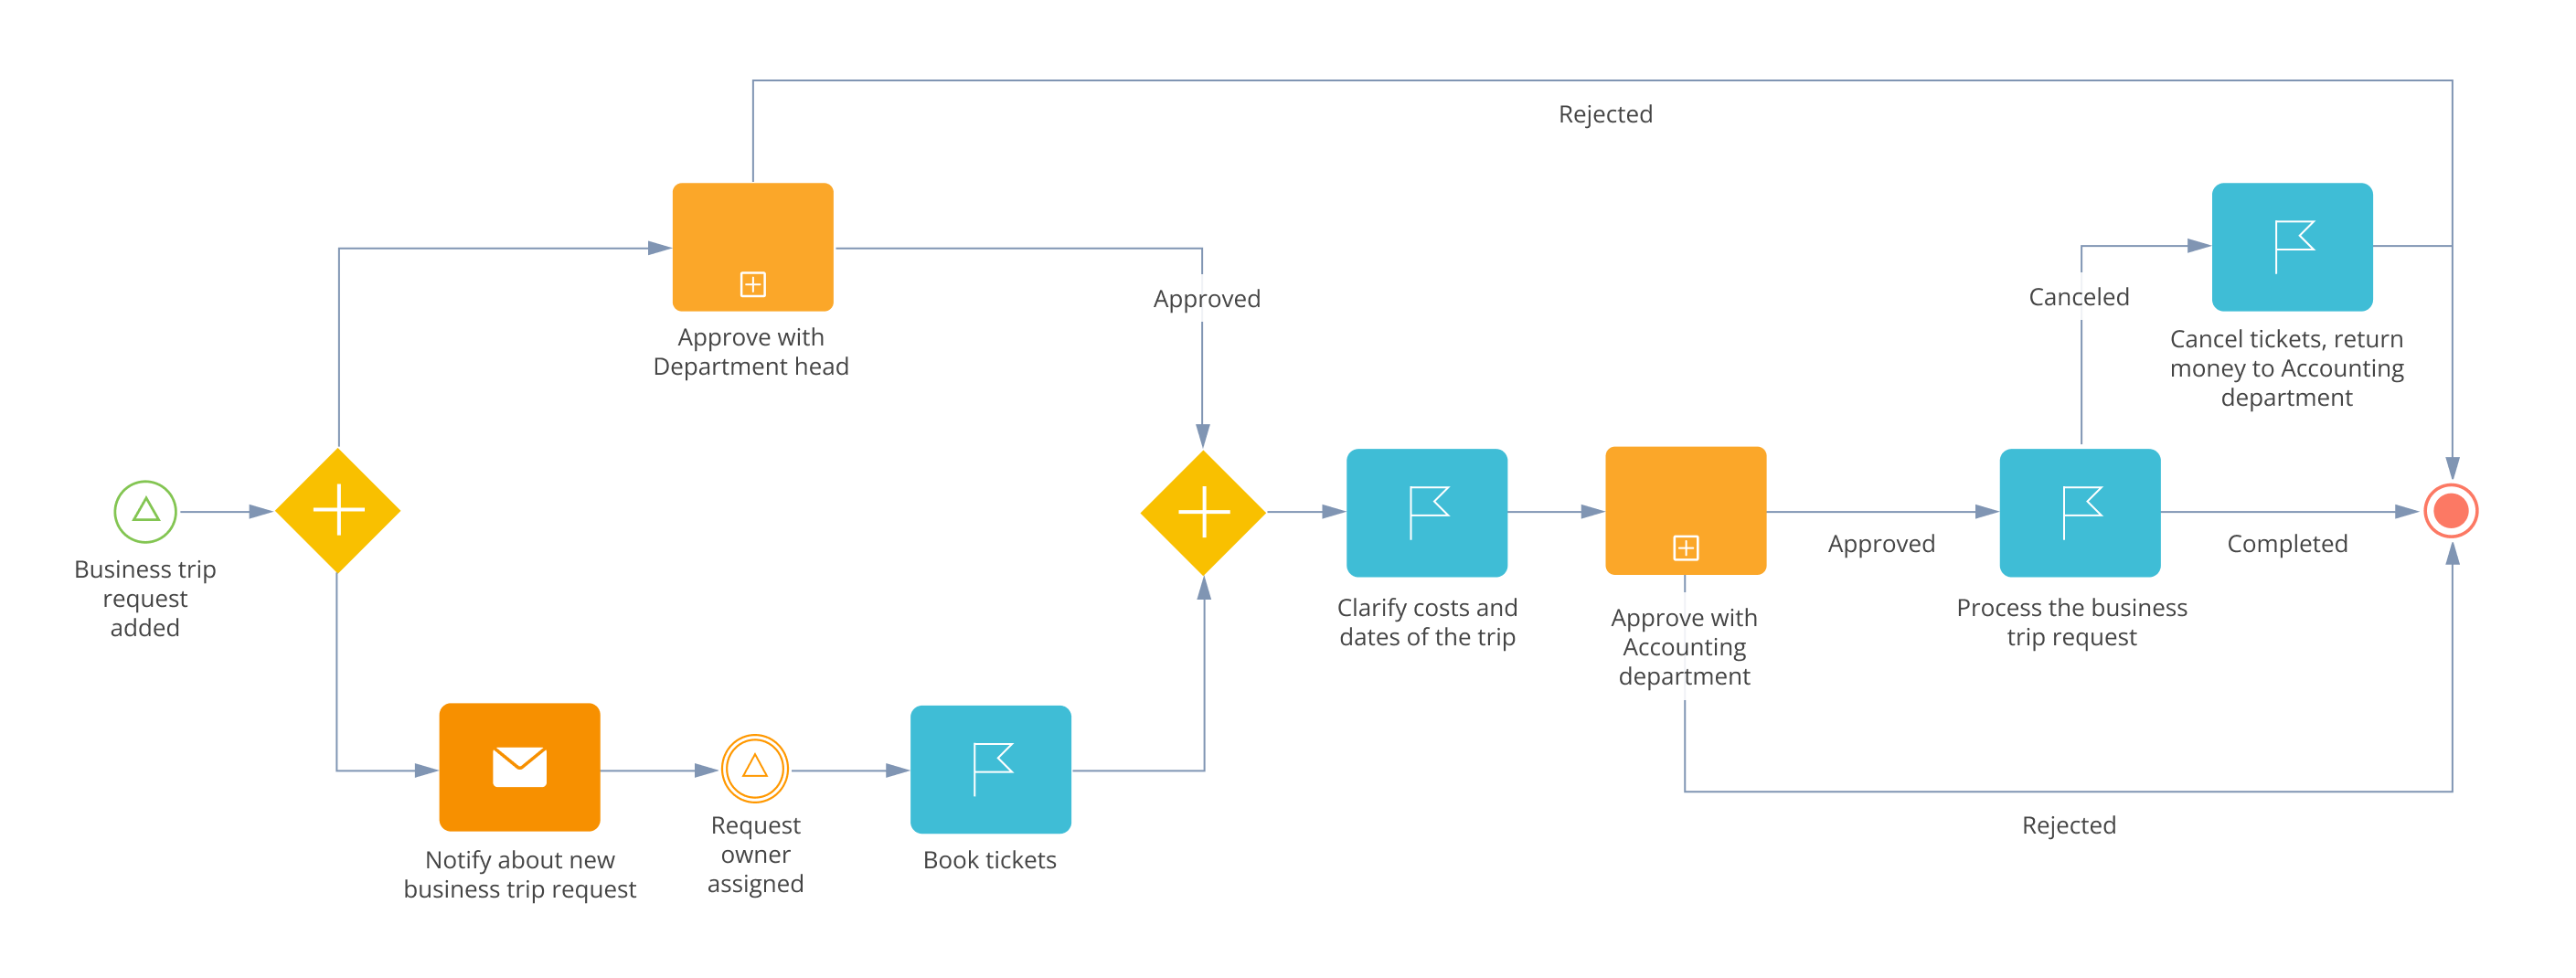
In financial institutions such as banking, workflows are used for client onboarding and loan processing. Once an application is submitted, a series of sequential tasks commences including client identity verification, disclosure of statements, credit approvals and contract signing. All transaction records are documented and stored for audit purposes.
Medical institutions
Patient admission, triage, and discharge are streamlined in a workflow that includes registration, insurance, diagnosis management, discharge approval and billing. During patient transfers, medical records can be routed to the appropriate doctor, and patient records are tracked and kept up to date for future appointments.
Educational centers
Education centers can manage several daily operations by using workflow diagrams. Educators can better monitor student progress throughout the academic period by, relevant assignments and/or exams. Additionally, onboarding of new students which includes the management of personal files, access to admin resources and orientation can also be mapped out using workflow diagrams.
Ecommerce
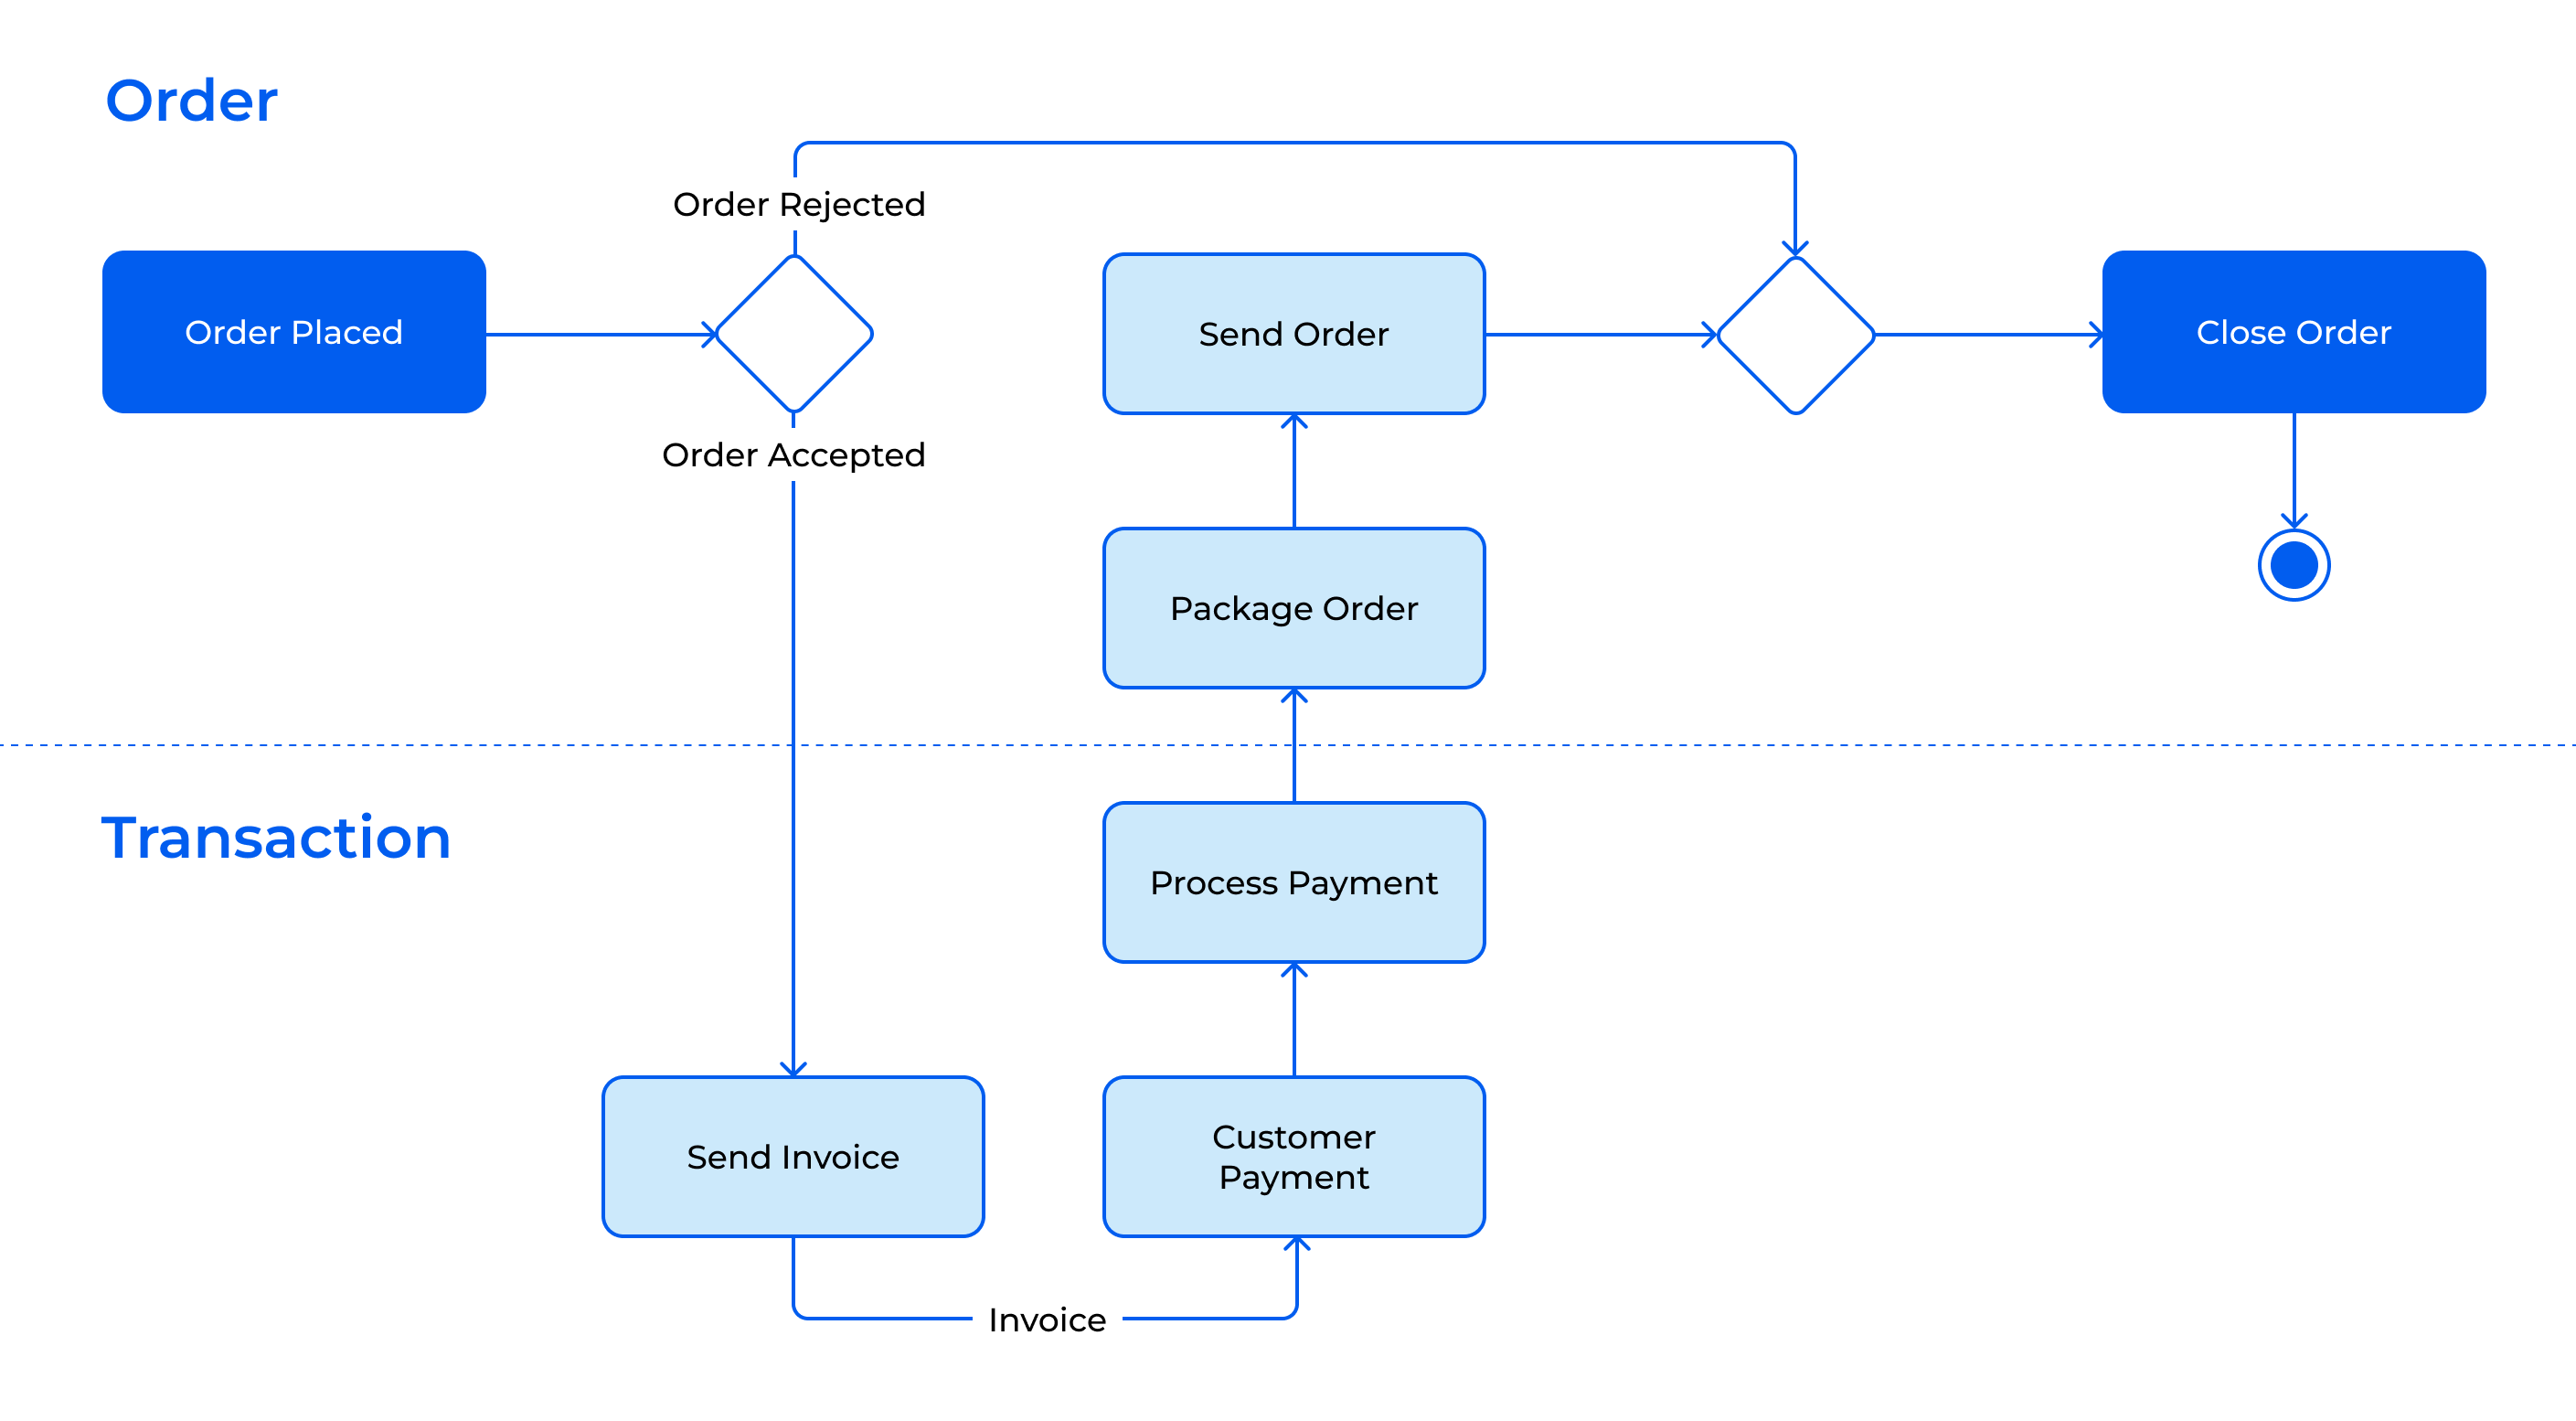
A prevalent e-commerce workflow includes an order submission. A customer places an order, fills in their payment information, the transaction is then processed, and a payment is received. Once the order is received, the item(s) are then selected from a warehouse, packaged into a parcel, and shipped to the customer.
How to Create a Workflow Diagram?
Prior to diving in and creating a workflow diagram, users should research and assess which type of workflow diagram suits their business needs best. Once the diagram is selected, outline a diagram with rough ideas from the team. Next, conduct research and workflow analysis. Once you gain the data now, you can easily compile a workflow chart. Note you should understand the components, symbols, and shapes before insulting any on the workflow diagram. Users can implement advanced visual tools from Creatio that ease the creation process.
Common Symbols and Components
| Name | Symbol | Importance/meaning |
| Oval |  | Oval shapes represent the start and end of the business process. |
| Rectangle |  | The rectangular shape is the workhorse of the workflow diagram; it represents any step in the process |
| Diamonds |  | Diamonds indicate that a decision is required to move forward. Decision options can include this-or-that, binary or multiple-choice options. |
| Arrows | Arrows connect the shapes and symbols to guide the user to the next step. |
Irrespective of the type of workflow diagram, there are three basic components that remain unchanged: input, transformation, output. Every step within a workflow falls into one of these components:
- Input: The resource (for example, employee or material) that completes or initiates a step in the workflow.
- Transformation: The direction or rule of how input is received, and what transpires when it is received.
- Output: The result of the transformation, be it a deliverable or product. The output can also function as the input for the following step in a workflow.
At a high level, all processes can be reduced to these three components. In reality, most processes are an intricate combination of several inputs, transformations, and outputs.
Steps to Creating a Workflow Diagram
Step 1: Selecting appropriate workflow graph/diagram
Before formulating a workflow diagram, the appropriate workflow diagram type should be selected. Note, the type of workflow diagram a business selects, affects the business process.
Step 2: Gather enough data
The gathering of data involves the identification of resources: what is currently in place, how is it being managed, who is involved in the management, etc. Ensure to involve your team and ask questions pertaining to processing times, solutions options and actions, and resources involvement.
Step 3: Create a workflow
After gathering and analyzing data, a workflow chart can be designed with all the details concluded. This will help in providing a visual representation of the process you’re creating.
Step 4: Improving the diagrams
It’s easy to make improvements after creating the workflow diagram symbols. Users can amend the inefficiencies and adjust as needed. The involve of the workflow development team is crucial to test the workflow and ensure it functions optimally.
Workflow Management in Creatio
Creatio provides innovative workflow analysis and workflow design solutions, empowering users to create process diagrams tailored to any industry with ease. Through an intuitive visual interface equipped with drag-and-drop functionality, users can effortlessly construct workflows from scratch. Whether opting for pre-designed industry templates or crafting custom workflows, Creatio offers flexibility to meet the specific needs of any organization. With its no-code approach, Creatio simplifies operations, driving enhanced efficiency and productivity.

